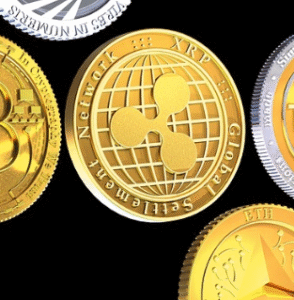
$XRP $BTC $ETH
#Crypto #XRP #Ripple #Cryptocurrency #Trading #Investing #Blockchain #DigitalCurrency #Finance #MarketTrends #SupportLevels #ResistanceLevels #TechnicalAnalysis #PriceMovement
In the world of cryptocurrency, where volatility is the only constant, XRP’s recent price movements have caught the eye of investors and analysts alike. Having corrected gains from the $0.530 zone, XRP is now testing a crucial support level at $0.520, a development that could dictate its short-term trajectory. This testing ground comes after a modest uptrend that saw prices pushing above the $0.5150 mark, briefly surpassing the $0.520 resistance level. Despite these movements, XRP has somewhat lagged behind its peers, Bitcoin and Ethereum, in terms of momentum. However, the resilience of XRP’s price above $0.5200 and its stance above the 100-hourly Simple Moving Average (SMA) suggest a potentially bullish undertone. A vital bullish trend line on the hourly chart of the XRP/USD pair further underscores this sentiment, hinting at a possible rebound if the currency surpasses the $0.5300 resistance zone.
The dynamics surrounding XRP’s price fluctuations are a testament to the highly speculative nature of cryptocurrency markets. As XRP revisits its support level, the broader context of its price action reveals a series of resistance hurdles that could shape its near-term outlook. Initial resistance near the $0.5250 mark presents the first challenge, followed by a more significant barrier at $0.5300. Surpassing these levels could pave the way for further gains, with potential targets lying at $0.5450, $0.5550, and even stretching towards the $0.5850 mark in the near term. The ultimate milestone in this bullish scenario would be the $0.6000 resistance level. These movements are not occurring in isolation; they reflect broader market trends, investor sentiment, and the interplay of supply and demand dynamics in the crypto space.
Conversely, the potential for a downward shift remains a palpable risk for XRP holders. Should XRP fail to breach the $0.5250 resistance zone, it might signal the beginning of another price decline. The immediate support levels to watch in such a scenario would be around $0.5200, followed closely by the $0.5185 mark—which coincides with the 61.8% Fibonacci retracement level of the latest upward wave. A decisive break below these supports could exacerbate sell-off pressures, possibly leading the price towards the $0.5050 support or further down to the critical $0.5000 psychological level. This bearish outlook necessitates a careful consideration of risk management strategies among investors.
Technical indicators, including the Hourly Moving Average Convergence Divergence (MACD) and the Relative Strength Index (RSI), offer additional insights into XRP’s price momentum. Currently, the MACD is losing pace in the bullish zone, suggesting a potential slowdown in the upward price movement. Meanwhile, the RSI standing below the 50 level indicates a tilt towards bearish sentiment in the near term. Together, these technical indicators, along with the identified support and resistance levels, form a comprehensive framework for analyzing XRP’s price actions. As always, in the highly unpredictable landscape of cryptocurrency trading, vigilance and prudent analysis remain the cornerstones of successful investment decisions.


Comments are closed.